Skip to content
metaproc
Launch

Features

A button-driven, template-based workflow that covers the whole meta-analysis, from a raw extraction workbook to a GRADE summary of findings and a re-runnable bundle.

Watch it run, 73 seconds

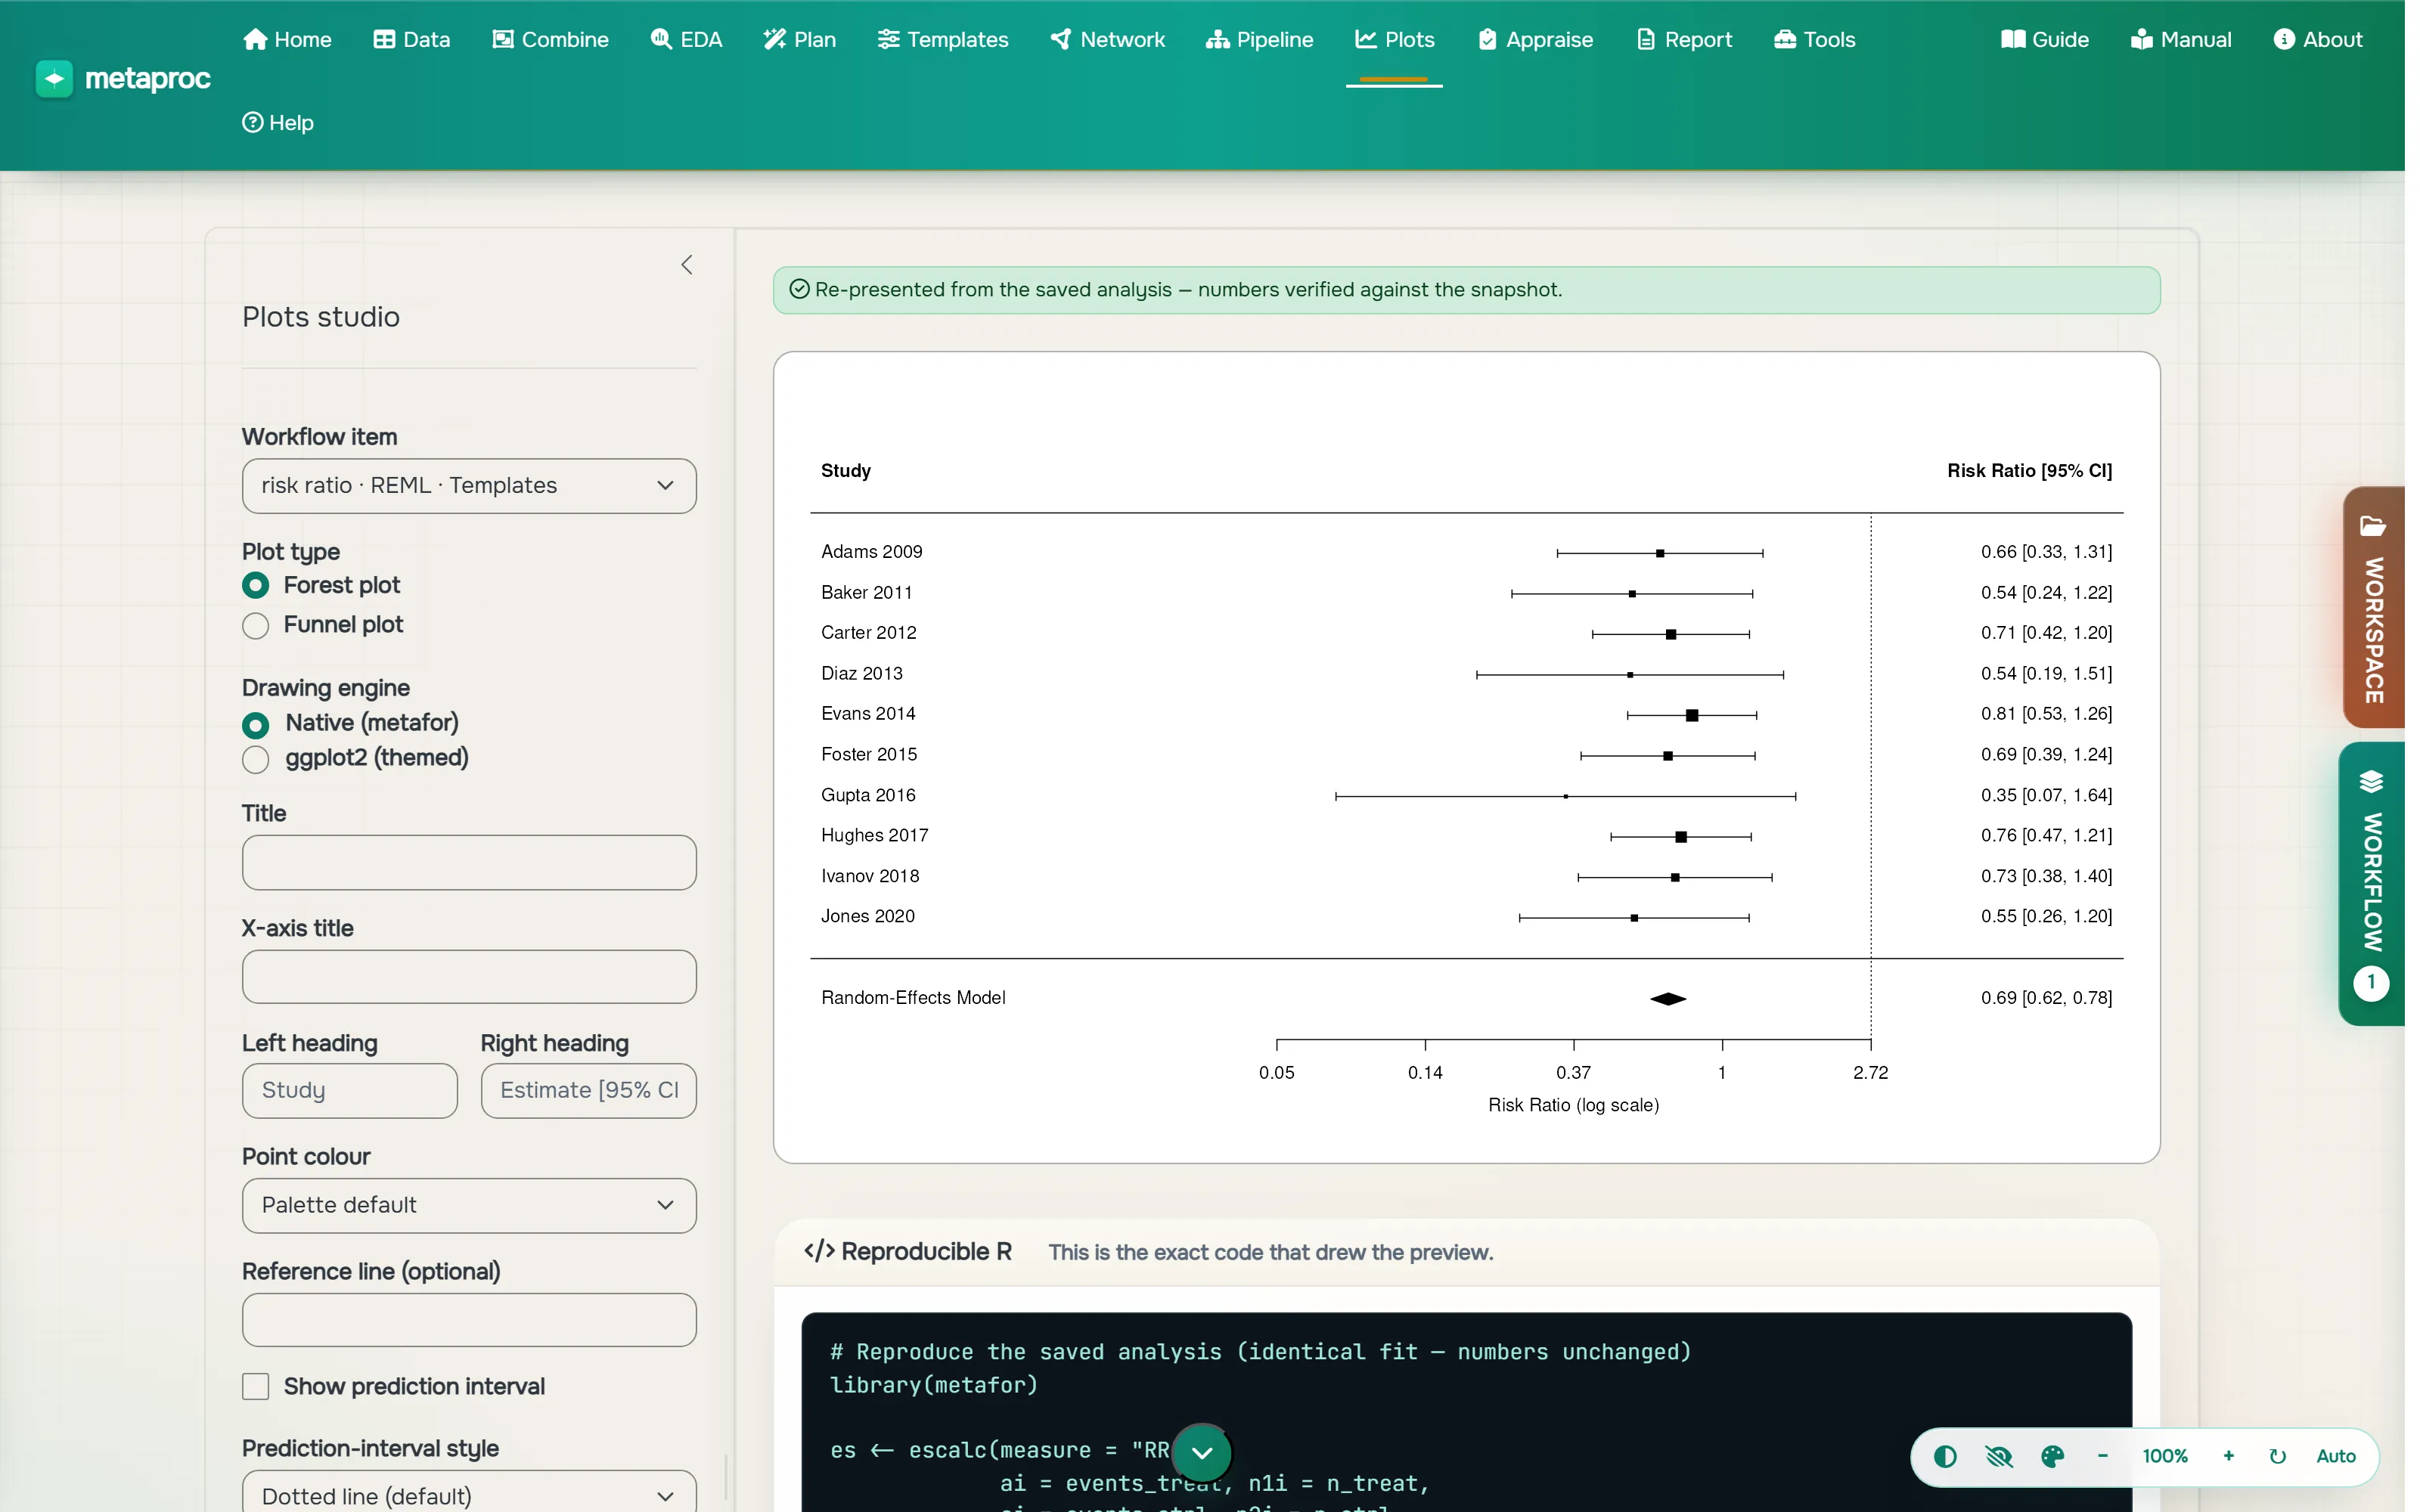
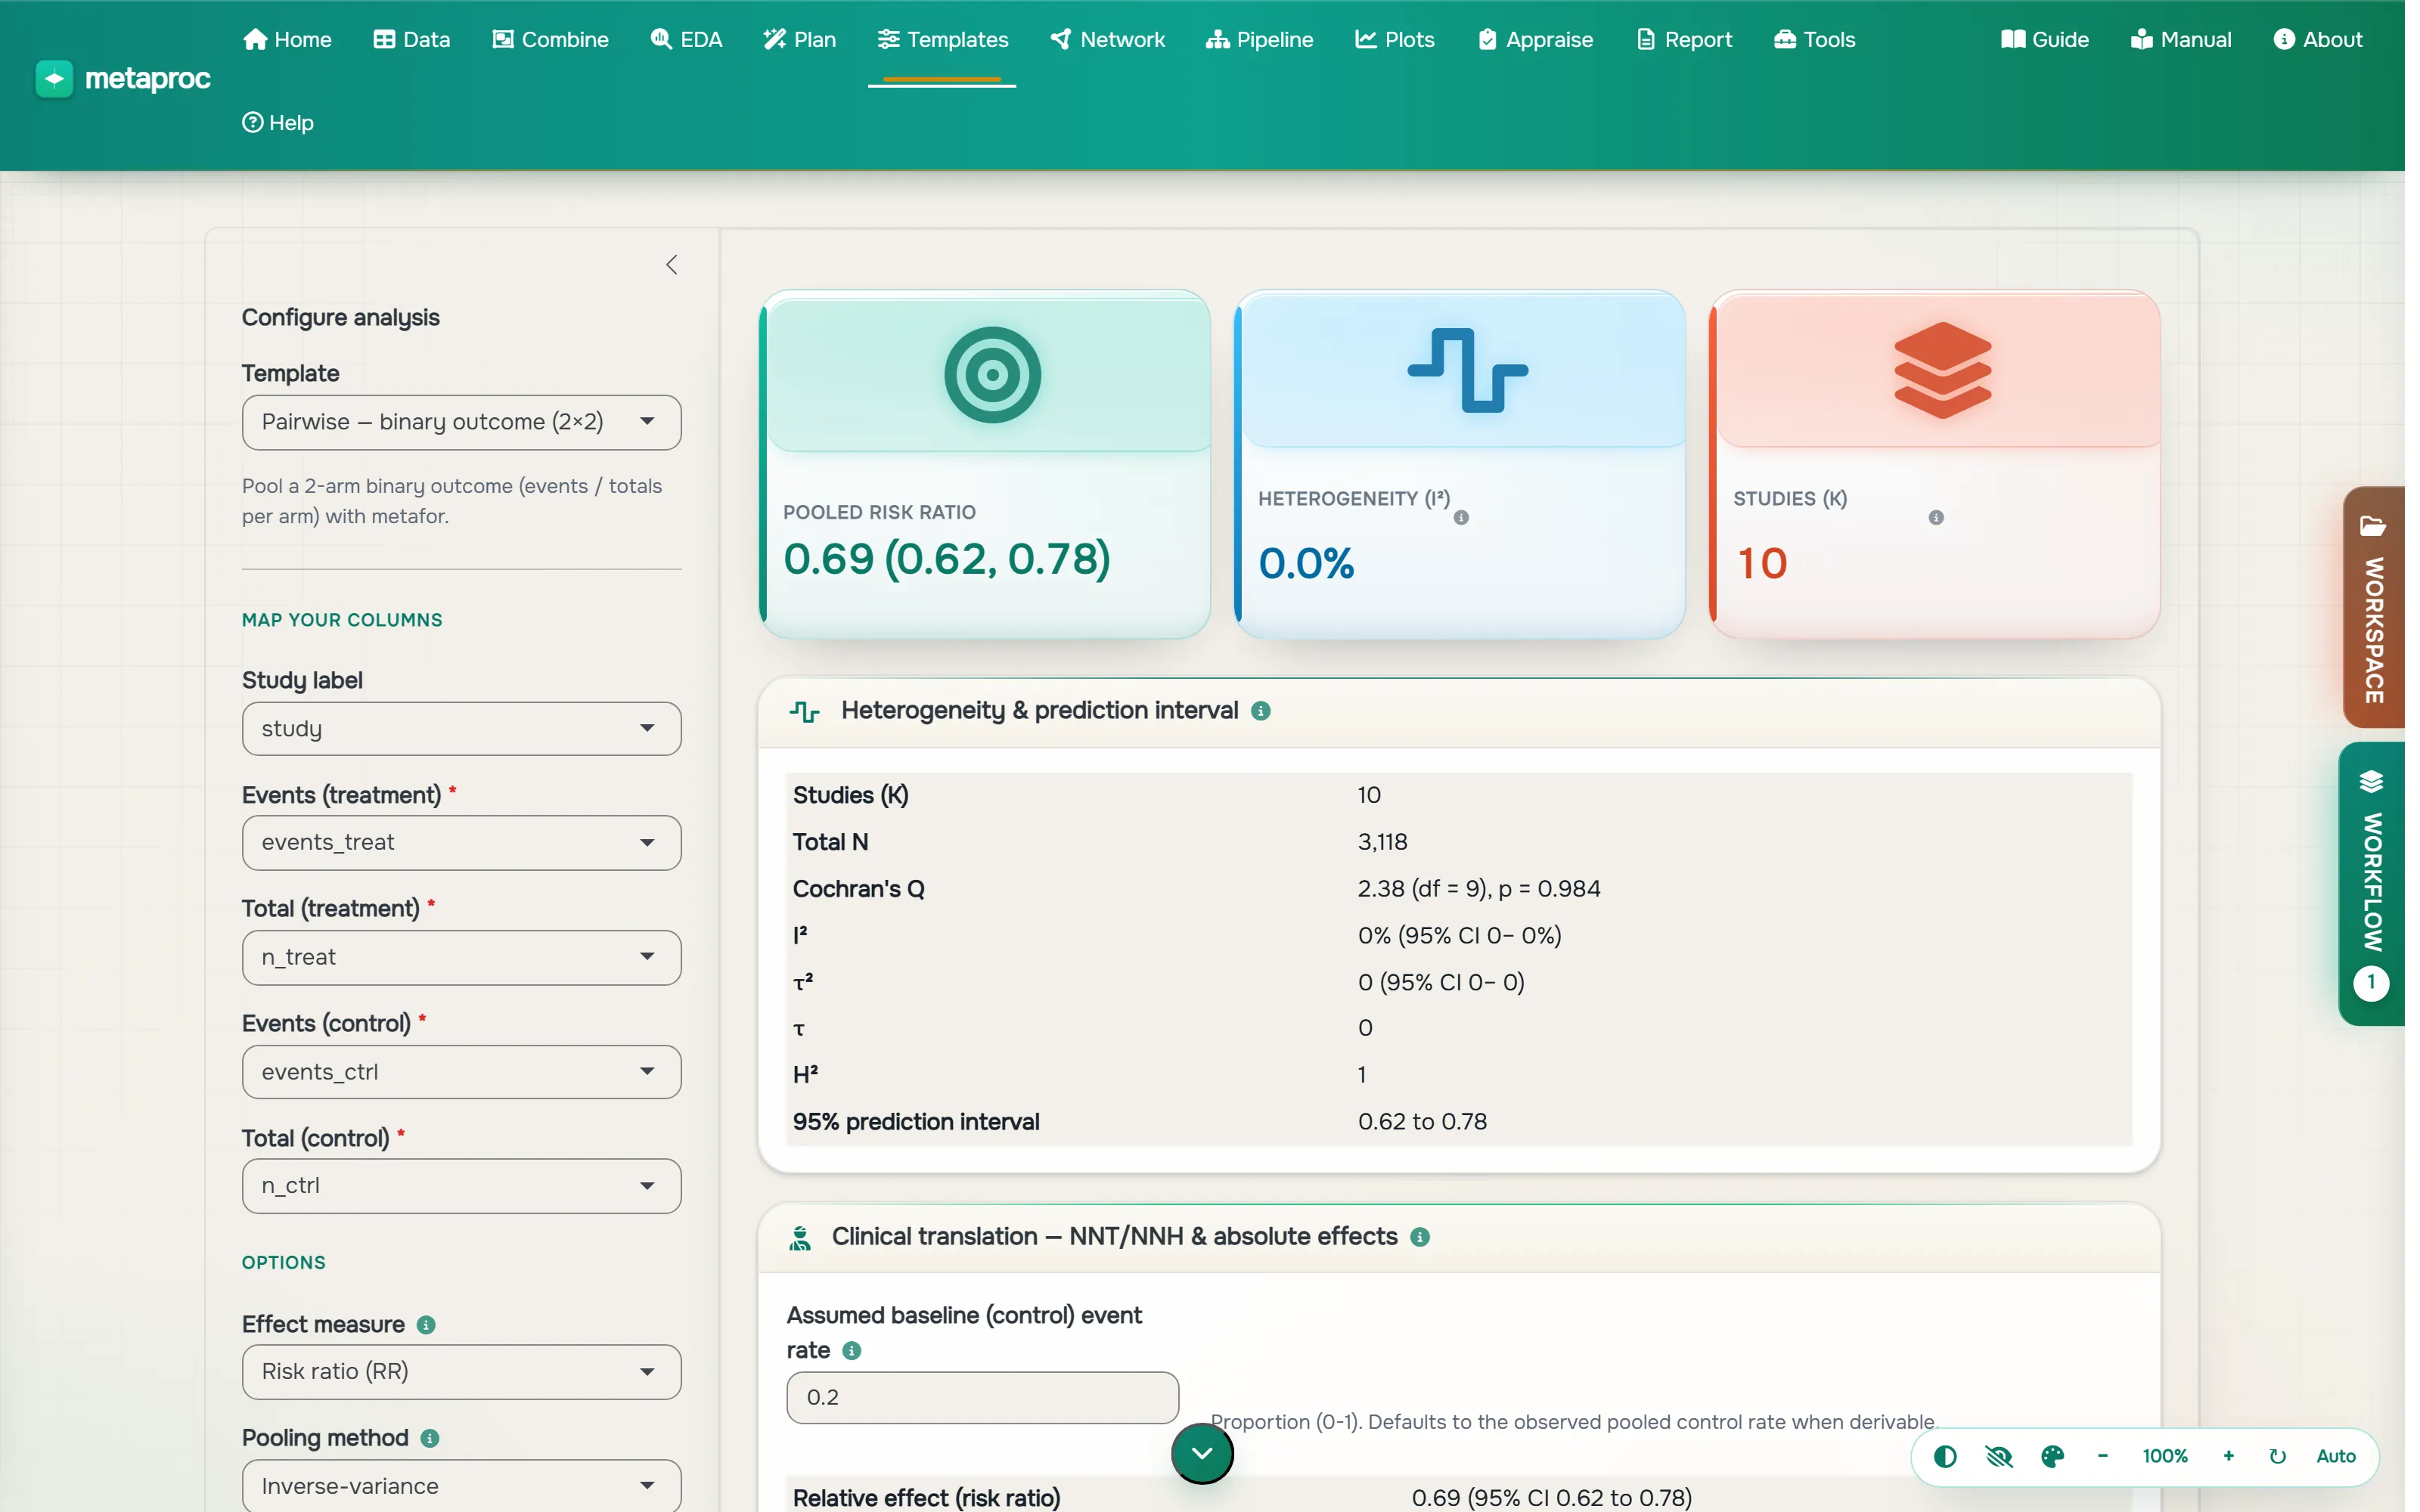
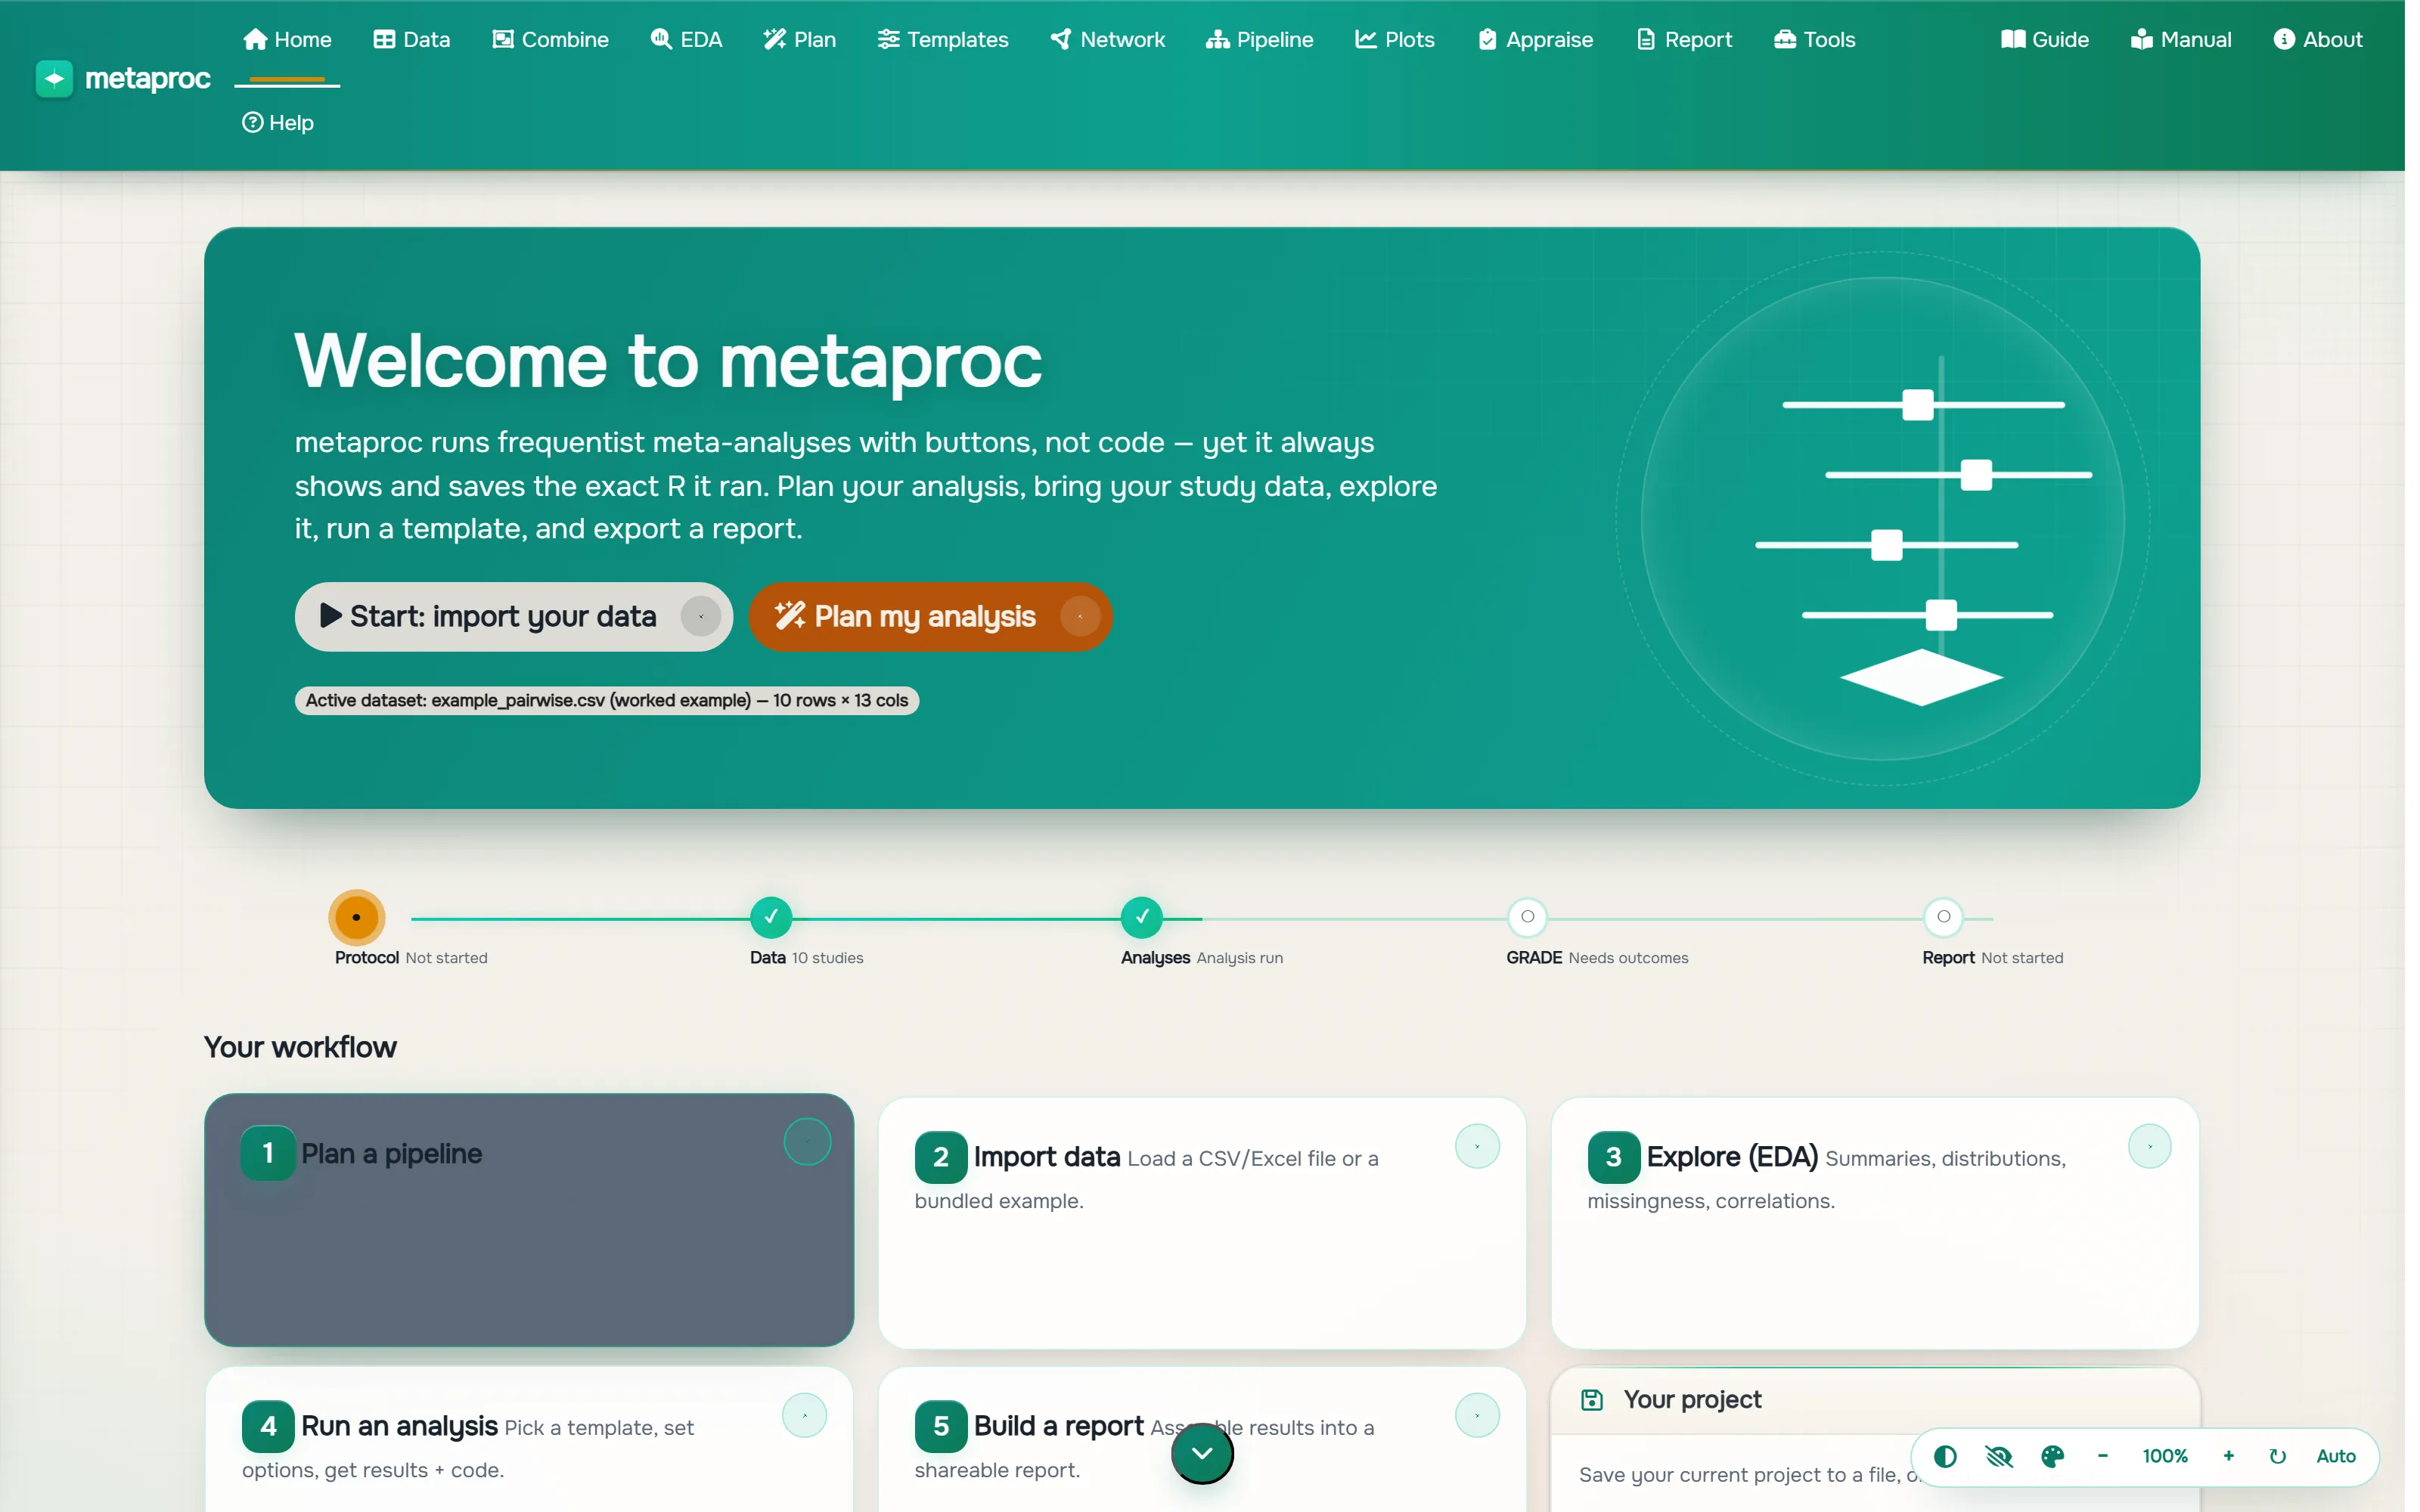
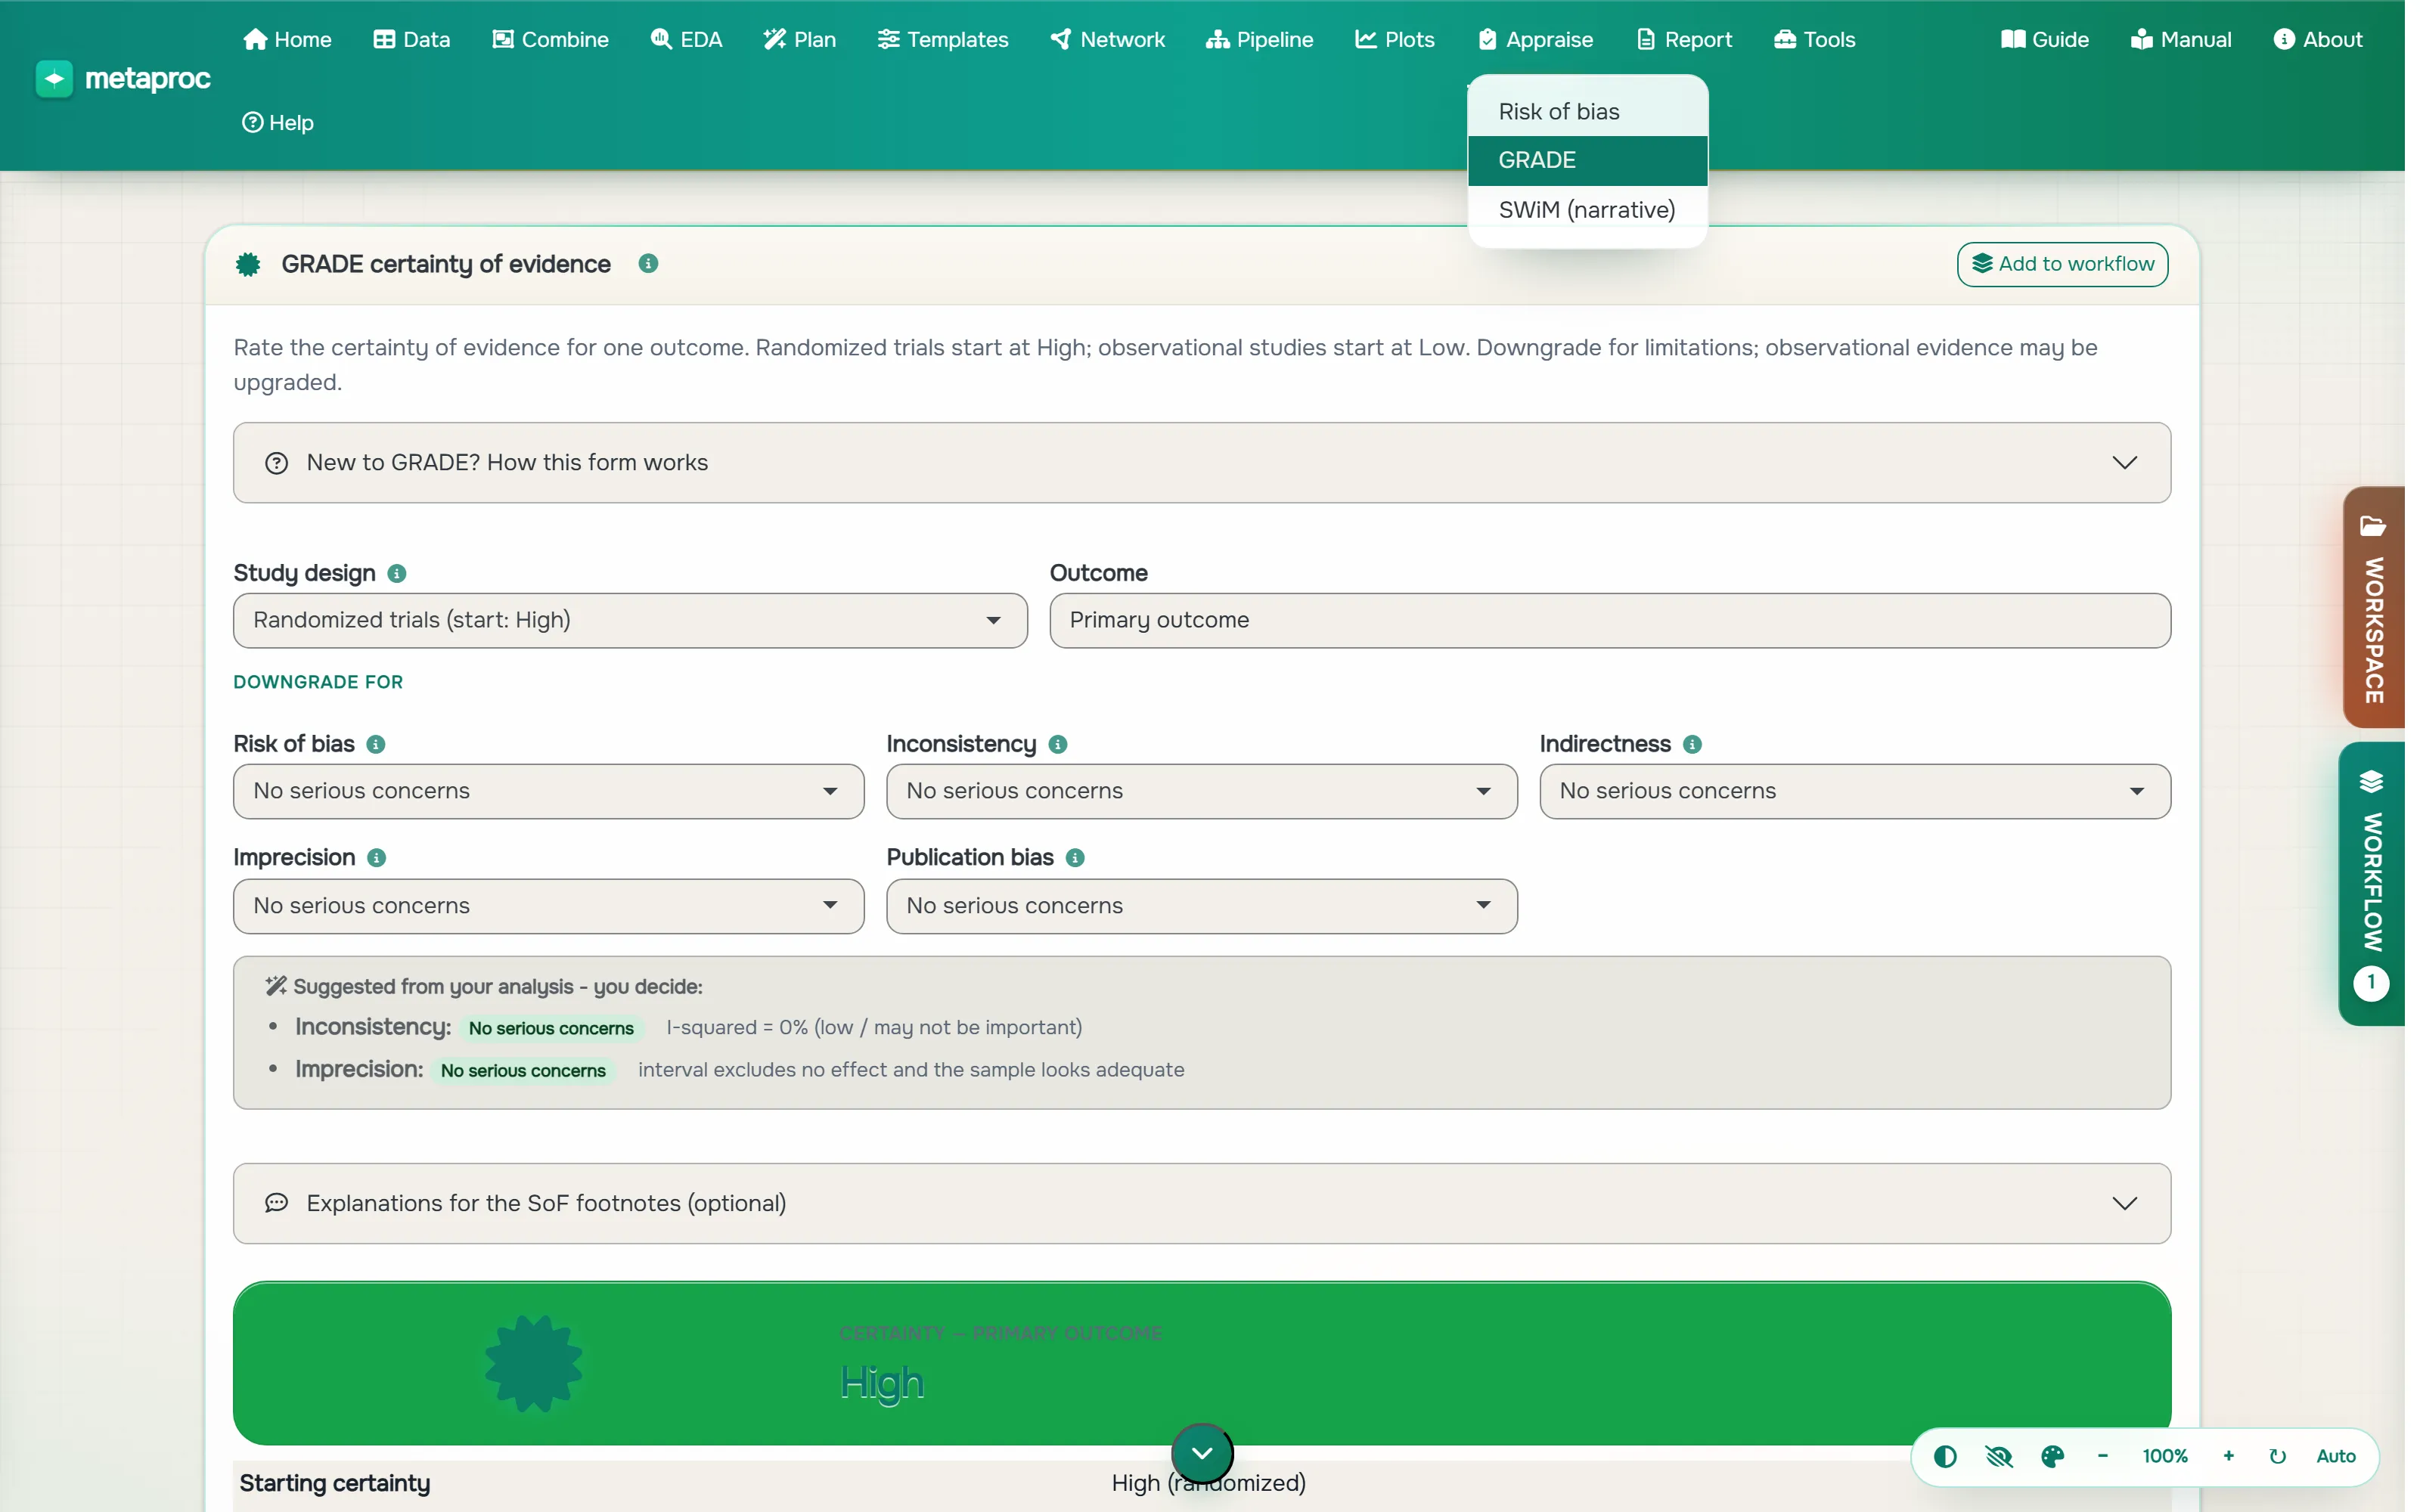
A silent screen capture from the live app: the pairwise binary-outcome template loads a worked example, pools ten trials (risk ratio 0.69, I² 0%), gets a GRADE certainty rating, and ends at the report builder and the re-drawn forest plot. Captions describe each step.

Import and prepare

Get messy real-world extraction workbooks into shape, without leaving the browser.

  • Data import CSV and Excel upload, multi-sheet workbooks, automatic header detection, value boxes.
  • Edit and clean Editable grid, per-column retype and rename, row include or exclude, each emitting its exact R.
  • Combine Join or stack worksheets with auto-detected keys, a grain guard, and fan-out warnings.
  • Quality checks Duplicate study-ID detection, biological-range checks, configurable consistency rules.

Explore and analyze

Eleven templates, a six-view EDA, network meta-analysis, and a drag-to-build pipeline.

Plots studio: a ten-study forest plot of risk ratios with a random-effects pooled estimate of 0.69 (0.62 to 0.78), plot-type and drawing-engine controls (native metafor or ggplot2) on the left, and a Reproducible R panel underneath labelled "the exact code that drew the preview".
Plots studio: forest and funnel plots with prediction intervals, re-drawn from your saved analysis and verified against its snapshot. The exact R that drew the preview sits right below.
Live R code panel beside its raw output: a metafor script (library(metafor), escalc effect-size computation, an rma REML model, forest() and funnel() calls) next to the printed random-effects model results with tau-squared, I-squared and the Q test.
Every analysis shows the exact R code it ran, metafor calls included, next to the raw model output it produced. Copy it, audit it, re-run it.
The Workflow panel open over the home screen, holding a saved risk-ratio analysis card with buttons to send it to the Plots studio or the Report, and a note that it is saved with your project.
The workflow store collects results across tabs: reorder them, send them to the Plots studio or the Report, and they persist with your saved project.
  • EDA studio Summary, distributions, missingness, correlations, by-group, and scatter, each with code.
  • Templates Binary, continuous, proportion, correlation, HR, IRR, three-level and more.
  • Network MA netmeta network plot, league table, P-scores, and net-split inconsistency.
  • Pipeline Drag components (meta-regression, cumulative, trim-and-fill, Baujat) into an ordered run.
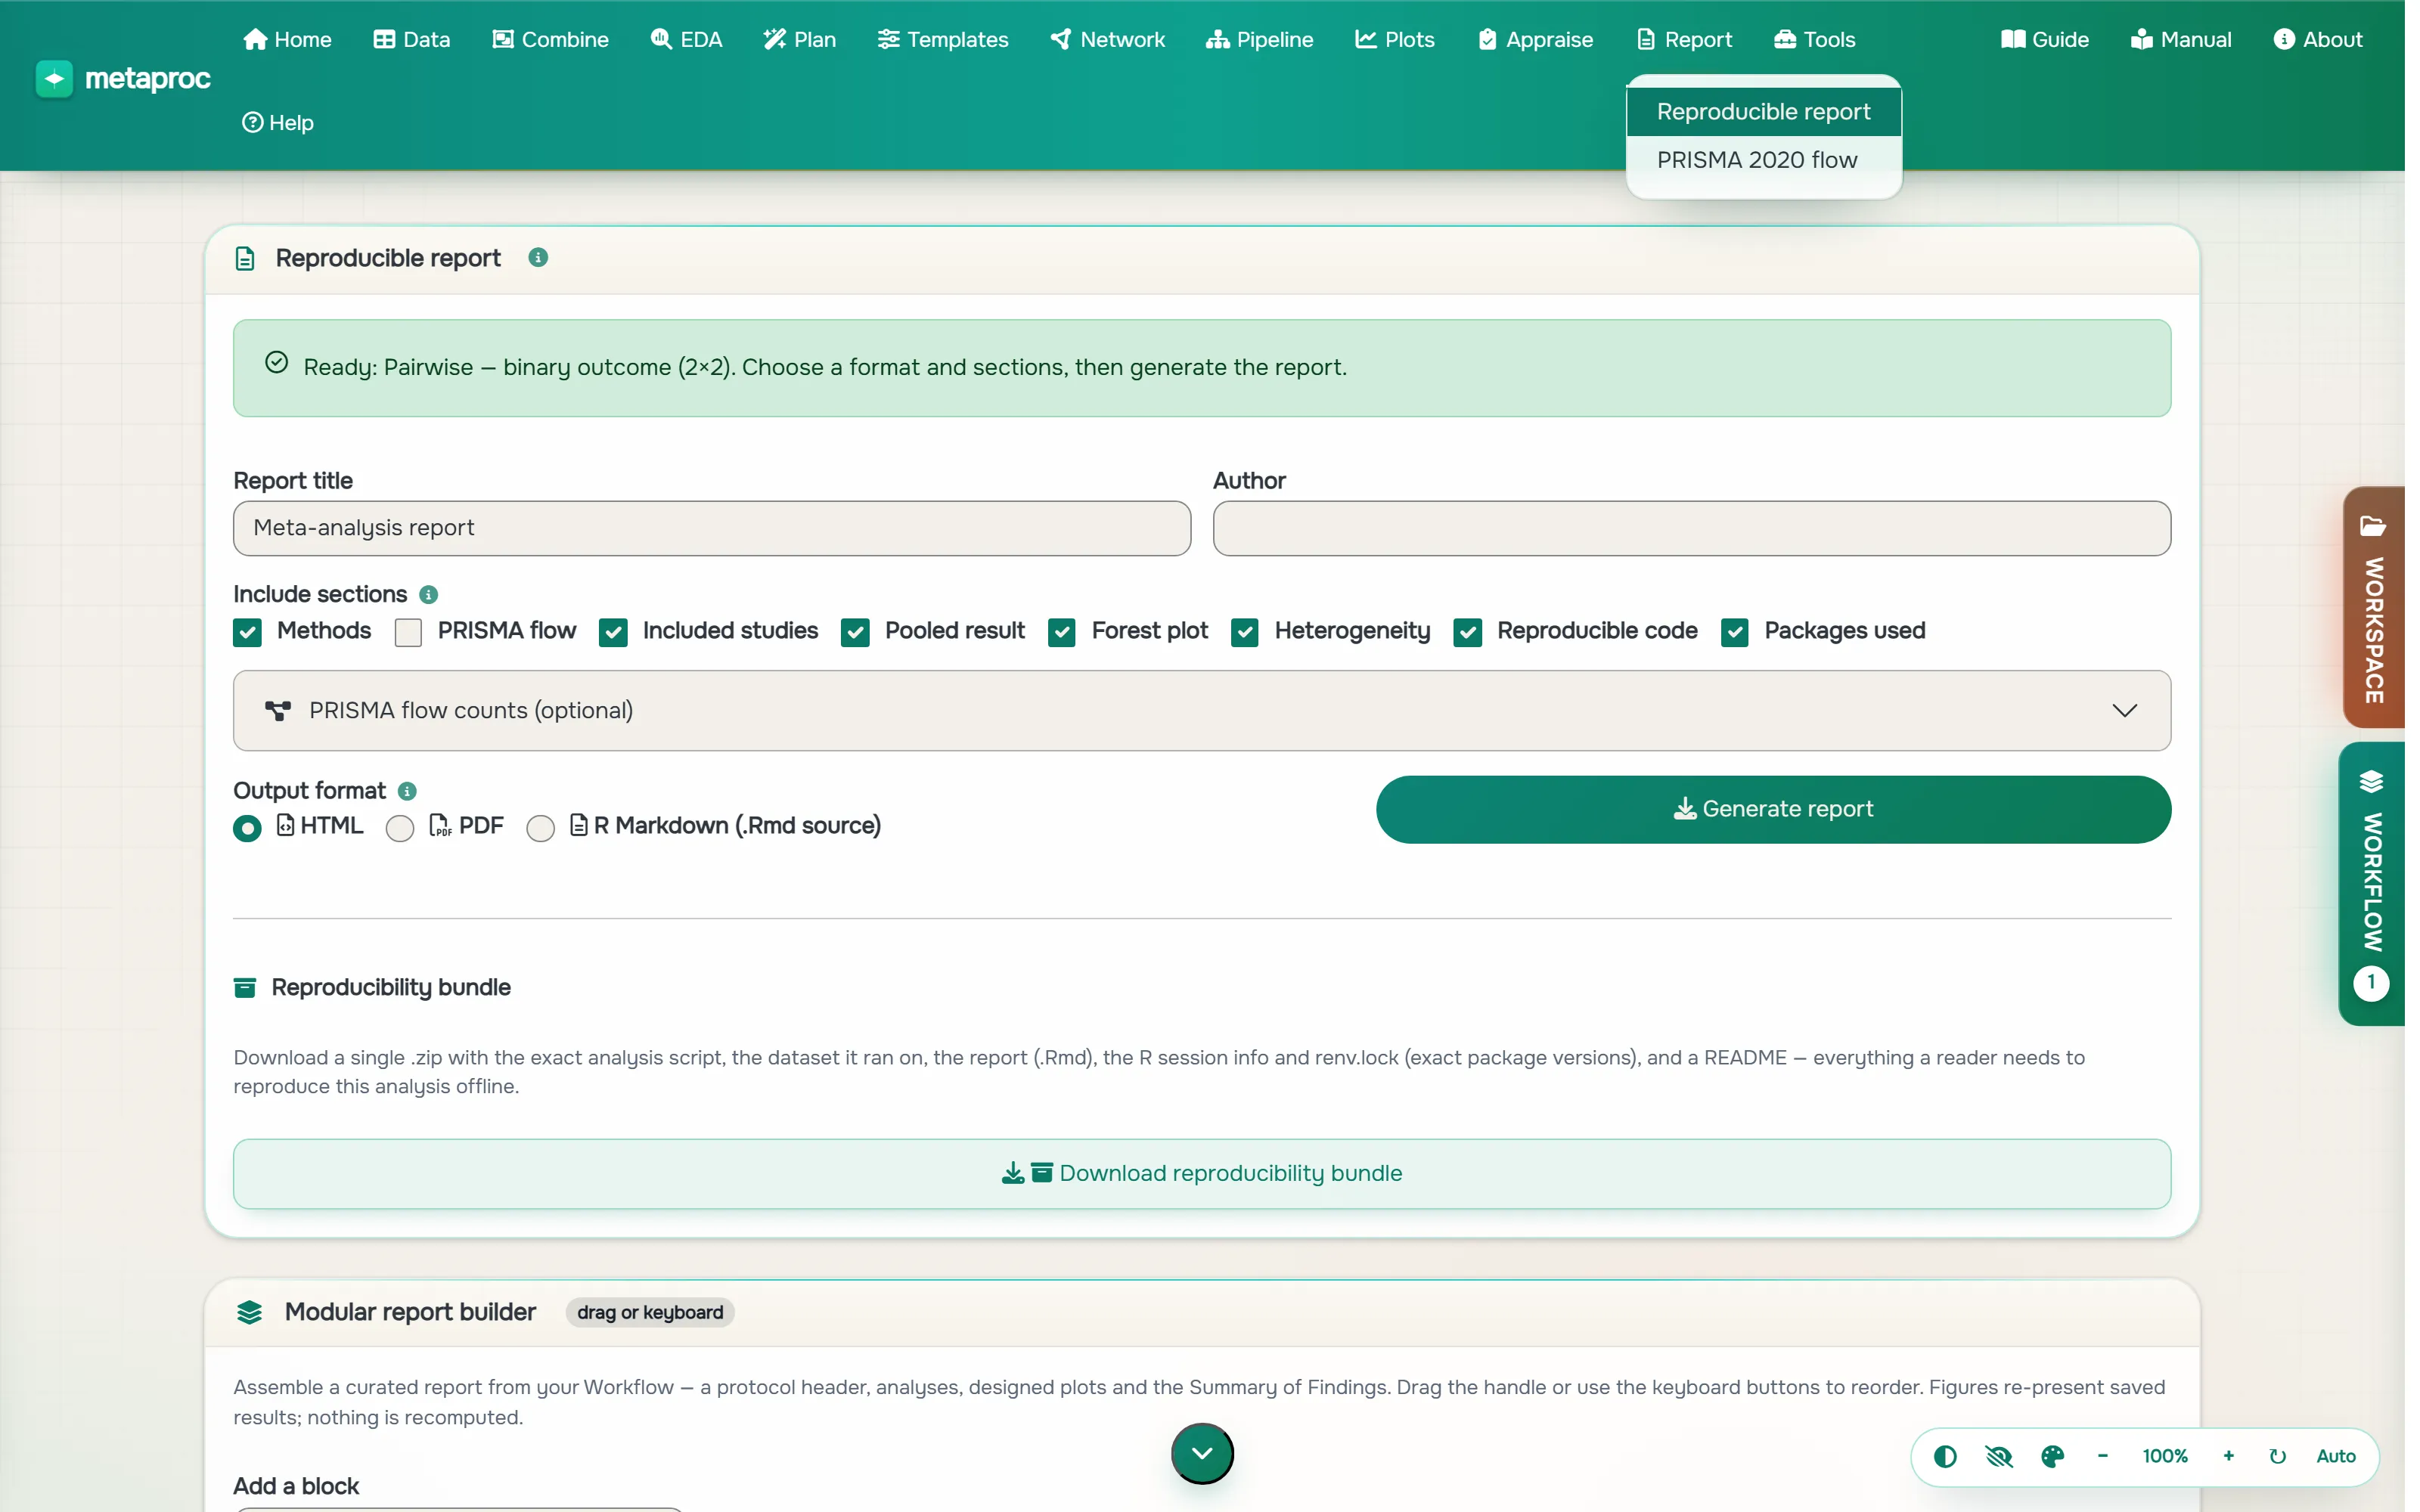
Appraise and report

Risk of bias, GRADE, SWiM, PRISMA, and a reproducibility bundle that re-runs anywhere.

GRADE certainty-of-evidence form: study design and outcome fields, the five downgrade domains (risk of bias, inconsistency, indirectness, imprecision, publication bias) and a "suggested from your analysis" box citing the observed I-squared and confidence interval.
GRADE: rate certainty across the five domains, with suggestions pre-filled from your live analysis, feeding a Cochrane-style summary-of-findings row.
Reproducible report builder: title and author fields, include-section checkboxes (methods, PRISMA flow, included studies, pooled result, forest plot, heterogeneity, reproducible code, packages used), HTML / PDF / R Markdown output formats, and a reproducibility-bundle download button.
Report builder: choose sections, generate HTML, PDF or .Rmd, or download the reproducibility bundle: a .zip with the exact analysis script, your data, sessionInfo() and renv.lock.
  • Risk of bias RoB 2, ROBINS-I and QUADAS-2 traffic-light and summary plots (robvis).
  • SWiM and PRISMA Vote-counting harvest plot and a PRISMA 2020 flow diagram from your screening data.
  • Reproducibility bundle A .zip with runnable analysis.R, the data, sessionInfo(), and renv.lock.
  • Tools Effect-size converter (12 conversions) and a-priori power analysis.

Every screenshot and the demo above are real captures from the live app (June 2026 beta); nothing is mocked up. For the exact, up-to-date capability inventory, see the generated product manual.